Common UI Document Properties
Overview
All OCLI UI Documents are registered in the database as GeoJSON Feature objects (row per document) in the features table. The UI consumes these Features to locate the document payload, render it on the map or in panels, and display legends/metadata.
Standard GeoJSON Envelope
type:Featureid: optional string/UUID for stable reference (also present in properties asuid)geometry: Geometry appropriate for the document (often the footprint or point of interest)properties: A JSON object with standard and type-specific fields (see below)
Common Properties
The following properties MUST or SHOULD be present across all document types (DB-aligned).
Required
type(string): One of the supported document types (Scalar, Mesh, PointCloud, Cluster, Image, Report, Media, Vector, DEM, Actor, Shape).source(object): How and where to load the document. Typically includes:url(string): e.g.,/tiler/tiles/{z}/{x}/{y}@2xor/s3/<bucket>/<key>orwss://...type(string):Raster|GeoJSON|Mesh|PointCloud|Media|Report|websocketurl_params(object) [optional]: e.g.,{ "url": "http://rook-ceph.../staging/<path>.tiff" }when using the tilertileSize,max_zoom,attribution[optional]
Recommended
roles(array[string]): e.g.,["public_read", "demo_read", "draft_read"]Bucket(string),Endpoint(string),ResultKey(string),version(number),friendly_name(string)classification(object): e.g.,{ "ocli": [5], "metadata_preset": [6] }visible_metadata(array[object]): items with{label, value}surfaced by UIbands(object): for raster-like documents; see “Bands and band_meta” belowlegend(object): Links and rules for the legend panelmetadata(object): Freeform, but keep stable keys for pipelines
Color Maps
Color maps define how numeric values in raster‑like documents are translated into colors for rendering. They are specified per band in properties.bands.band_meta[].color_map and are the foundation from which UI legends are derived.
The monitored‑AI schema supports two colormap types:
Preset colormaps
Preset colormaps reference UI‑known color schemes by name. Use presets whenever possible for consistency across products.
Supported preset names:
Gray LinearSpaceStripes,Inverted StripesBlue to Red,Red to BlueYellow to Brown,Brown to GreenSunrise,SunsetNDVI,SAVI,EVINDWI,Inverted NDWICopper,Pink,HazeRed to GrayHSV,ParulaGreen-Red-Blue-WhiteRainbow,Blue-Green-Red-YellowAqua FlameStandard GammaDecrease Hue,Increase HueAccent,Saturn,SupernovePeanut butter and JerryHot MetalAMD Iron,AMD Heatmap
Example:
{
  "color_map": {
    "type": "preset",
    "name": "AMD Heatmap"
  }
}
Linear gradient colormaps
Linear gradients define explicit color stops across the data domain.
{
  "color_map": {
    "type": "linearGradient",
    "stops": [
      { "offset": 0.0, "color": "#000000" },
      { "offset": 1.0, "color": "#ff0000" }
    ]
  }
}
Offsets may be floats (0.0–1.0) or percentage strings ("0%"–"100%").
Supported document types
Color maps are supported only for the following document types:
DEMDEMStackScalar
Other document types must not define color_map.
Relationship to legends
Color maps define rendering.
Legends annotate meaningful values on top of a color map.
Legends are optional; color maps are required for meaningful visualization.
Legend
There are auto-generated and custom legends.
Custom legends - could be attached to an any document or layer.
They define the representation of a legend and may be provided either as a “structured color list”, or a “static image”.
Auto-generated legends in OCLI UI documents (DEM, DEMStack, Scalar and Actor) are derived from band and colormap metadata, not defined as a standalone top‑level object.
This mirrors the monitored‑AI schema and ensures legends are generated directly from pipeline outputs without duplicating rendering logic.
Custom legends
To add legend to your document please define properties.legend object.
Property |
Type |
Description |
|---|---|---|
|
|
|
|
|
Could be an object, a list of objects or string with base64 encoded image. Depends on a legend type. |
Colors List
To add colors list with labels into legend (as shown on a picture below) please see the example of properties.legend object.
properties.legend.data[].color color should be in hex format #RRGGBB. properties.legend.data[].label – a string label.
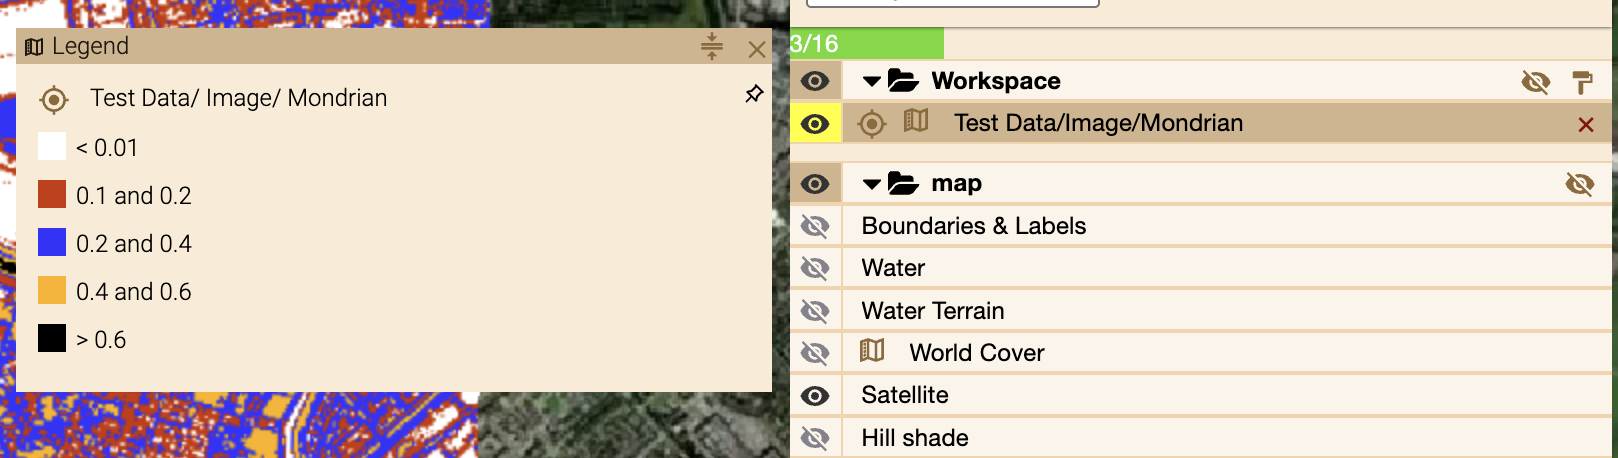
{
  "type": "colorList",
  "data": [
    {
      "color": "#ffffff",
      "label": "< 0.01"
    }, {
      "color": "#cc3300",
      "label": "0.1 and 0.2"
    }, {
      "color": "#3333ff",
      "label": "0.2 and 0.4"
    }, {
      "color": "#ffb200",
      "label": "0.4 and 0.6"
    }, {
      "color": "#000000",
      "label": "> 0.6"
    }
  ]
}
Linear Gradient
To display a linear gradient bar with an arbitrary number of stops and a collection of labels, please see the example below.
Constraints:
properties.legend.data.stops[].value,properties.legend.data.labels[].valuemust be numeric.properties.legend.data.stops[].colorshould be in hex format.
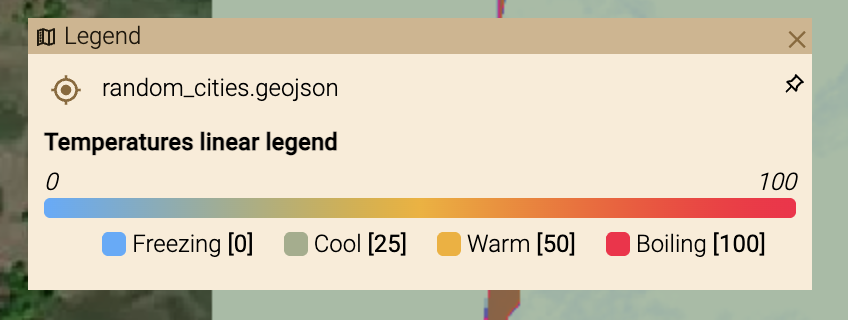
{
  "type": "linearGradient",
  "data": {
      "title": "Temperatures linear legend",
      "domain_min": 0,
      "domain_max": 100,
      "stops": [
          {
              "color": "#4facfe",
              "value": 0.0
          },
          {
              "color": "#f5af19",
              "value": 50.0
          },
          {
              "color": "#ff0844",
              "value": 100.0
          }
      ],
      "labels": [
          {
              "name": "Freezing",
              "value": 0.0
          },
          {
              "name": "Cool",
              "value": 25.0
          },
          {
              "name": "Warm",
              "value": 50.0
          },
          {
              "name": "Boiling",
              "value": 100.0
          }
      ]
  }
}
Image
To display image in a legend popup window - please add base64 encoded image into properties.legend.data property.
Or set a https link to an image.
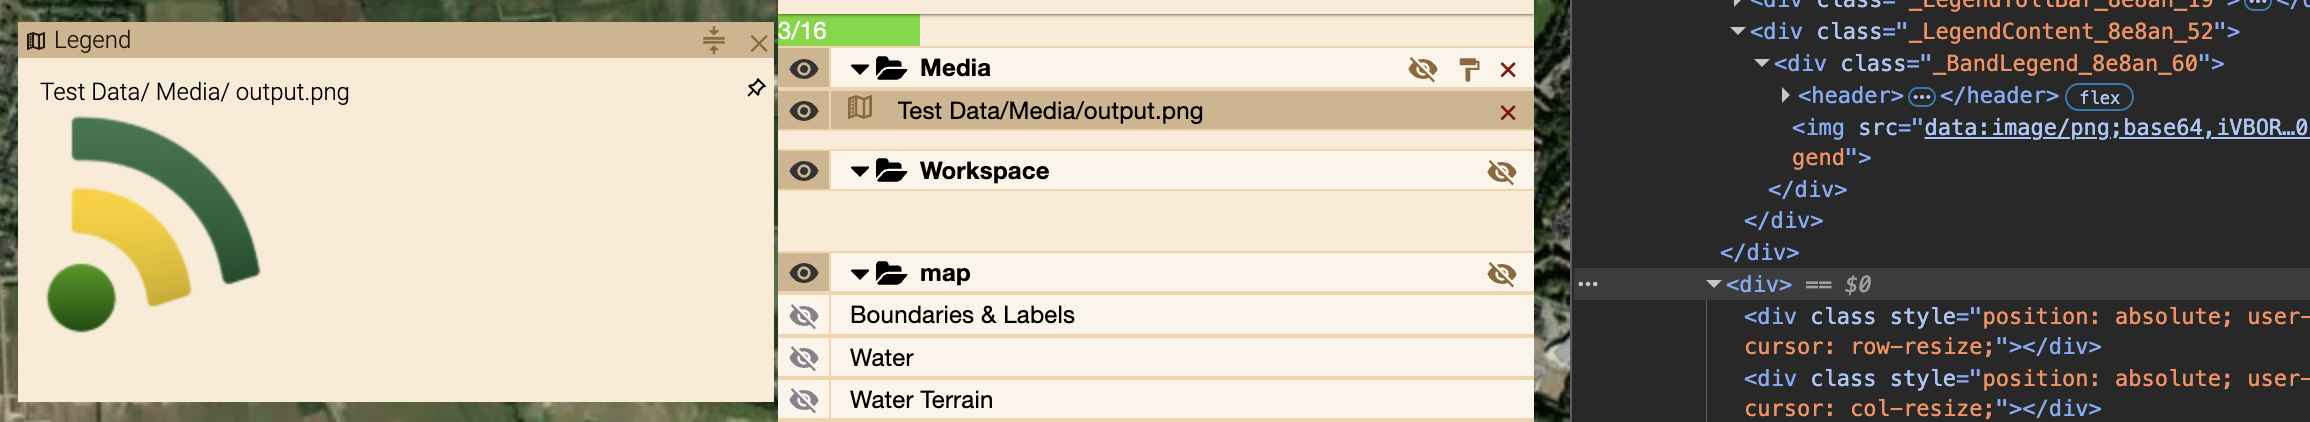
{
  "type": "image",
  "data": "data:image/png;base64..."
}
DEM, DEMStack, and Scalar Legends
Where legends live
Legends are defined inside:
properties.bands.band_meta[].color_map.legend
Each legend entry describes the semantic meaning of a value on the data domain. The UI combines:
the numeric domain (
domain_min,domain_max)the colormap definition (
color_map)the legend items (
color_map.legend)
to render the legend panel.
Legend items
A legend item represents a labeled point on a numeric scale.
{
  "name": "High confidence",
  "value": 0.9
}
Fields:
name: Human‑readable label shown in the UI.value: Numeric value within the band domain.color(optional): Explicit CSS color; if omitted, the UI samples the colormap atvalue.
Legend items do not define ranges or categories directly. They annotate important values along a continuous or stepped scale.
Preset colormaps
When using a named colormap preset, legend items provide semantic anchors on the preset scale.
{
  "color_map": {
    "type": "preset",
    "name": "AMD Heatmap",
    "legend": [
      { "name": "Background", "value": 0.0 },
      { "name": "Activity", "value": 0.6 },
      { "name": "Alert", "value": 0.9 }
    ]
  }
}
Preset names must match UI‑supported colormaps. Legend values must align with the preset’s implicit domain.
Continuous legends
Used for scores, confidence maps, heatmaps, DEMs, and other scalar fields.
{
  "bands": {
    "band_ids": ["score"],
    "band_meta": [
      {
        "domain_min": 0.0,
        "domain_max": 1.0,
        "unit": "confidence",
        "color_map": {
          "type": "linearGradient",
          "stops": [
            { "offset": 0.0, "color": "#000000" },
            { "offset": 1.0, "color": "#ff0000" }
          ],
          "legend": [
            { "name": "Low", "value": 0.1 },
            { "name": "Medium", "value": 0.5 },
            { "name": "High", "value": 0.9 }
          ]
        }
      }
    ]
  }
}
Actor Legends
Actor documents do not use bands or colormaps. Legends for Actors describe symbol meaning, not numeric scales, and their structure is defined explicitly in the monitored‑AI schema.
Actor legends are defined per actor layer, not at the document root.
Schema path:
properties.layers[].legends
Each entry in legends is a [label, color] tuple, where:
label: Display name shown in the UI legendcolor: CSS color used for the actor symbol
Example:
{
  "type": "Actor",
  "layers": [
    {
      "name": "Tracked vehicles",
      "color": "#e74c3c",
      "legends": [
        ["Friendly", "#2ecc71"],
        ["Unknown", "#f1c40f"],
        ["Hostile", "#e74c3c"]
      ]
    }
  ]
}
Notes:
Actor legends are layer‑scoped, not global.
The schema intentionally limits legend entries to
(label, color)pairs.Actor legends are descriptive only and must match how the actor stream or layer is styled.
OCLI Source object
In the production database, OCLI uses properties.source to describe where and how to load the document payload. This replaces the legacy payload object used in earlier drafts of this documentation.
Typical structure:
{
  "properties": {
    "source": {
      "url": "/tiler/tiles/{z}/{x}/{y}@2x",
      "type": "Raster",
      "max_zoom": 18,
      "tileSize": 512,
      "url_params": {
        "url": "http://rook-ceph-rgw-geo.rook-ceph.svc:80/staging/<project>/<path>/<file>.tiff"
      },
      "attribution": "optional attribution string"
    }
  }
}
Other common source.type values and expectations:
Raster: tile endpoint as above (COG/GeoTIFF behind the tiler) or direct image URL for thumbnails
GeoJSON:
{"url": "/s3/<bucket>/<key>.geojson", "type": "GeoJSON"}Mesh:
{"url": "/s3/<bucket>/<key>.glb", "type": "Mesh"}PointCloud:
{"url": "/s3/<bucket>/<key>.las.geojson", "type": "PointCloud"}Media:
{"url": "/s3/<bucket>/<key>.<ext>", "type": "Media"}Report:
{"url": "/s3/<bucket>/<key>.pdf", "type": "Report"}websocket:
{"url": "wss://...", "type": "websocket"}for live Actor/streamed data
Additional standard fields used by OCLI
At the properties level you will often see these fields:
roles: e.g., [“public_read”, “demo_read”, “draft_read”]Bucket: S3 bucket or namespace (e.g.,staging)Endpoint: S3/HTTP endpoint (e.g.,https://s3.optoss.net)ResultKey: Storage key/path for the document rootversion: number (pipeline or schema specific)friendly_name: human-readable path/nameclassification: object or arrays, e.g.,{ "ocli": [5], "inspire": [], "metadata_preset": [6] }visible_metadata: array of{label, value}pairs to surface in UIcentroid: GeoJSON Point with [lon, lat, (z)]geoReference: e.g.,{ "position": [lon, lat, z], "model_crs": "EPSG:4978" }for 3D assetslayers: array of layer descriptors for 3D meshes/voxels
Bands and band_meta
Raster-like documents (Image, DEM, Scalar, Cluster) often include a bands block:
{
  "properties": {
    "bands": {
      "band_ids": ["R", "G", "B", "A"],
      "band_meta": [
        {"band": 1, "name": "R", "type": "Byte", "min": 0, "max": 255, "domain_min": 0, "domain_max": 255},
        {"band": 2, "name": "G", "type": "Byte", "min": 0, "max": 255, "domain_min": 0, "domain_max": 255}
      ]
    }
  }
}
Optional keys in band_meta: mean, stdDev, color, color_map, noDataValue, description.
Migration note (legacy payload → source)
Legacy drafts in this folder used
properties.payloadwithhrefandmedia_type.The production schema uses
properties.sourcewithurlandtype(plus tiler parameters for rasters).When updating or creating documents, prefer
properties.source.Note: the UI/DB do not inspect
payload.media_type; if present in legacy examples, treat it as informational only.
DB‑aligned Base Feature Example (Image/Raster)
{
  "type": "Feature",
  "geometry": {"type": "Polygon", "coordinates": [[[4.4984604, 53.2402083], [4.4649804, 52.2534568], [6.0716785, 52.222566], [6.1417699, 53.2082014], [4.4984604, 53.2402083]]] },
  "properties": {
    "type": "Image",
    "roles": ["public_read"],
    "Bucket": "staging",
    "source": {
      "url": "/tiler/tiles/{z}/{x}/{y}@2x",
      "type": "Raster",
      "max_zoom": 16,
      "tileSize": 512,
      "url_params": {
        "url": "http://rook-ceph-rgw-geo.rook-ceph.svc/staging/default/composite/example.tiff"
      }
    },
    "version": 1.4,
    "Endpoint": "https://s3.optoss.net",
    "ResultKey": "default/composite/example",
    "friendly_name": "default/composite/example",
    "bands": {
      "band_ids": ["R","G","B","A"],
      "band_meta": [
        {"band": 1, "name": "R", "type": "Byte", "min": 0, "max": 255, "domain_min": 0, "domain_max": 255},
        {"band": 2, "name": "G", "type": "Byte", "min": 0, "max": 255, "domain_min": 0, "domain_max": 255},
        {"band": 3, "name": "B", "type": "Byte", "min": 0, "max": 255, "domain_min": 0, "domain_max": 255},
        {"band": 4, "name": "A", "type": "Byte", "min": 0, "max": 255, "domain_min": 0, "domain_max": 255}
      ]
    },
    "classification": {"ocli": [3]},
    "visible_metadata": [{"label": "Instrument", "value": "MSI"}]
  }
}